Key Takeaways:
- PEPE surged by 275% in May, followed by a significant pullback.
- A breakout from a descending triangle hints at the potential for a bullish phase.
- A developing five-wave structure suggests the beginning of an uptrend.
PEPE’s Price Journey So Far
PEPE has seen substantial price swings since its initial surge in April. After a massive rally, the token corrected downward, but now, technical indicators suggest the start of a possible new uptrend. However, more confirmation is needed to establish the token’s trajectory firmly.

PEPE Price Analysis
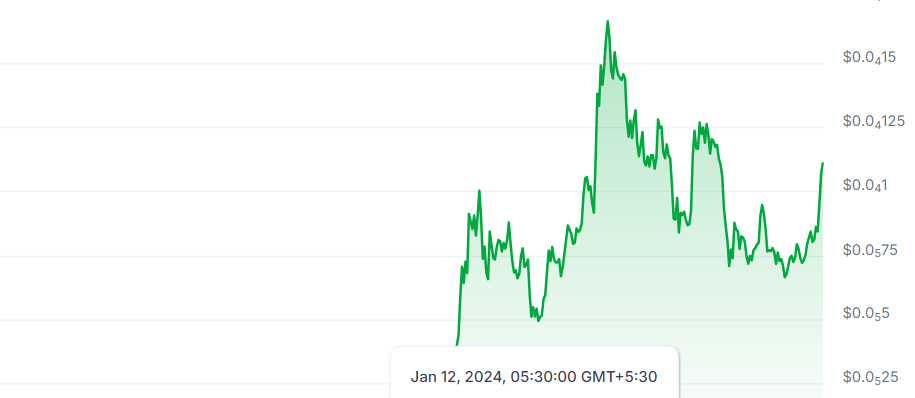
The token began its impressive run in April, peaking at $0.0000046, before continuing its ascent and hitting a high of $0.000017 on May 27—a staggering 275% rise. After reaching this high, PEPE entered a downtrend, bottoming out at $0.0000077 by July 5.
PEPE hovered around this level for a few days, retesting it on July 8 before trading sideways. A key resistance formed just below $0.000010. On July 15, PEPE finally broke through, moving above the descending channel and touching $0.000013 on July 19.
However, this breakout didn’t last long, as the price corrected again. On August 5, PEPE spiked to $0.0000058 but closed the day at $0.0000072, showing strong buying interest. After hitting a lower low of $0.0000065 on September 6, the downtrend appeared to slow, and the price rebounded.

This upward movement led to a breakout from the descending triangle, with PEPE hitting $0.0000107 on September 27, marking a 64% increase from its recent low. The completion of the WXY correction in May suggests that a new bullish phase may be forming, though further validation is still needed.
PEPE Price Prediction
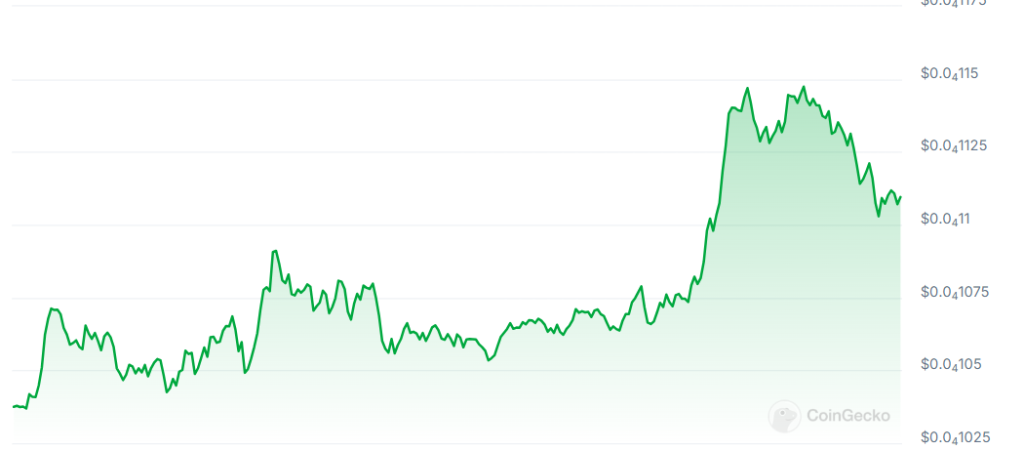
Looking at the hourly chart, since September 6, PEPE has been forming what seems to be three sub-waves of an anticipated five-wave impulse. Today’s high could represent the end of wave 3, especially with the hourly Relative Strength Index (RSI) entering the overbought zone.
In previous instances, when the RSI exceeded 80%, the token typically saw a retracement afterward. Based on Fibonacci extensions, the most recent rally from September 18 has slightly surpassed the 2 Fib level, suggesting a minor pullback could be imminent.
However, any retracement would likely be part of wave 4 in a five-wave pattern, meaning another push to a higher high, possibly around $0.000012, could follow. If this scenario unfolds, it would confirm PEPE’s first substantial uptrend and potentially mark the start of a new bullish phase.
Disclaimer
This article is meant for informational purposes and should not be considered financial advice. All investments carry risk, and past performance is not indicative of future results. It’s recommended to consult with a financial advisor before making any investment decisions.


